In this piece, I’ll talk about the unique challenges of debugging distributed programs and how we can build a command line interface (CLI) to be a distributed programmer’s chief assistant.
Infinite scaling, impossible debugging
Suppose I would like to build a memory-intensive 2D array in Python with a single CPU:
def f(x):
    return [i for i in range(x)]

lists = [f(i) for i in range(100000000)]
print(lists)
Upon running, I get a MemoryError. What happened? My computer ran out of memory, but where/when/how? To find out exactly where this happened, I can open up an IDE like PyCharm or VSCode and use a memory profiler to find out where lists became too large. I can also determine the precise function and call stack that caused it.
Now suppose I wanted to distribute my original program above to use 10 CPUs (each task runs on 1 CPU) with Ray, an open-source framework for building distributed applications.
@ray.remote(num_cpus=1)
def f(x):
    return [i for i in range(x)]

lists = [f.remote(i) for i in range(100000000)]
print(ray.get(lists))
When I add the @ray.remote function decorator, I declare that the function should be called remotely on the ten cores I have available, thereby allowing me to parallelize my construction of lists. Each remote call, f.remote(i), returns an object reference (ObjectRef), which is essentially a promise that the function will complete asynchronously. Then, I can call ray.get(<ref number>) to retrieve the actual return value. This pattern is very similar to the Promise paradigm in JavaScript.
My ten cores will form a Ray cluster like the diagram below:
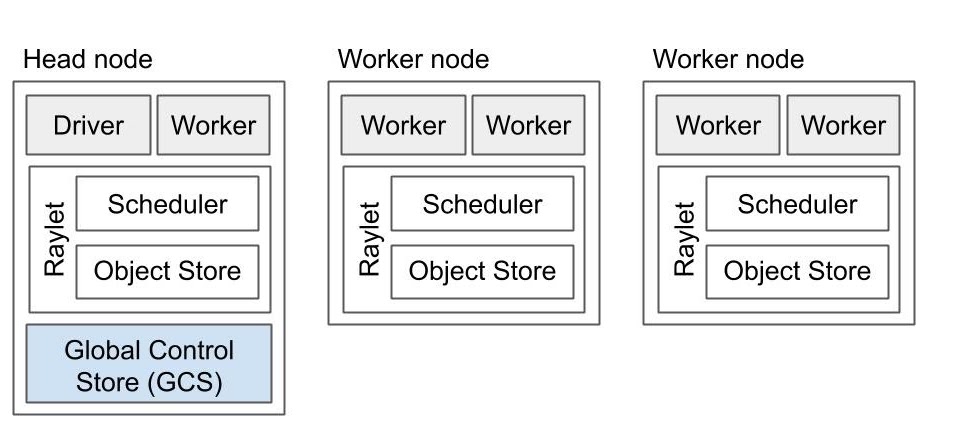
Upon running my new program, I get an ObjectStoreFullError. What happened? Ray stores memory-intensive objects like lists in a distributed object store. The store itself is distributed across our nodes' memory (a concept known as “ownership”). In the cluster diagram above, segments of our “Object Store” can be found across each node’s “Raylet.” Then, my CPU must make at least one remote procedure call (RPC) to the object store to reference lists. The main benefit of a distributed object store is it “allows a process to reference an object without having the object local, meaning that a process can reference objects whose total size exceeds the memory capacity of a single machine” (Source). For my toy example, my object store ran out of memory, but where/when/how? Answering this question isn’t so simple anymore. I can’t just open up an IDE and step through my code since I don’t know where the code is executing in the first place!
The answer seems simple—we need a debugger for distributed systems. The issue is, modern debuggers are well-suited for programs that execute in serial, but there aren’t known paradigms to “step-through” code running on multiple machines simultaneously.
A birds-eye view of distributed memory
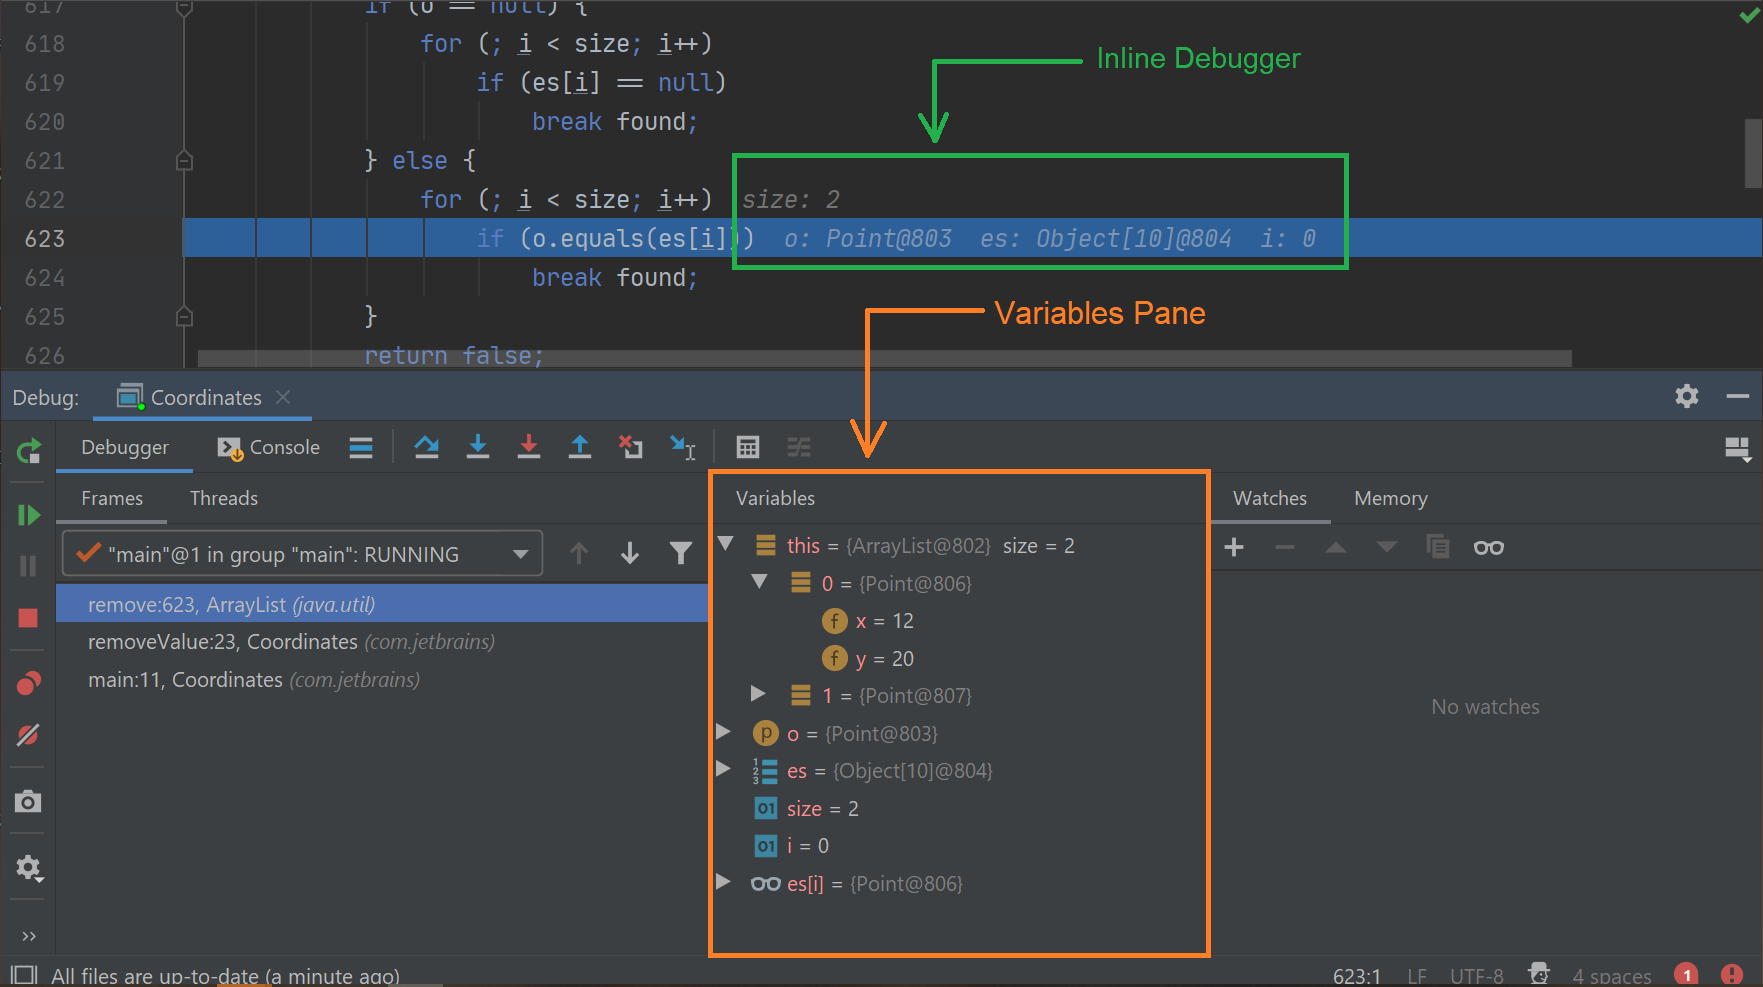
The following image depicts how debugging works in IntelliJ (same creator as PyCharm). Developers can step through their code during execution with an “Inline Debugger” while maintaining a clear birds-eye view of variables in scope with the “Variables Pane”.
Earlier, I mentioned that developers commonly use a “Memory Profiler” to inspect memory usage on a line-by-line basis. An example from the documentation is shown below, which pulls memory-related insights for functions with the @profile tag.
Line #    Mem usage    Increment  Occurences   Line Contents
============================================================
     3   38.816 MiB   38.816 MiB           1   @profile
     4                                         def my_func():
     5   46.492 MiB    7.676 MiB           1       a = [1] * (10 ** 6)
     6  199.117 MiB  152.625 MiB           1       b = [2] * (2 * 10 ** 7)
     7   46.629 MiB -152.488 MiB           1       del b
     8   46.629 MiB    0.000 MiB           1       return a
To debug ObjectStoreFullErrors, we want to maintain a birds-eye view of variables in scope along with the amount of memory each variable uses. In other words, how can we build a CLI that emulates both a “Variables Pane” and a “Memory Profiler” (a “Variable Profiler”?) for a program running in a cluster? This was the premise of my first major assignment in the open-source world, and I’m excited to share my results. If you read my last blog, you know I like to formulate the problem concisely like so:
Problem: Developers using Ray need to monitor ObjectRef references in scope that may cause ObjectStoreFullError errors.
Solution: My objective was to build an interactive CLI so that developers can effortlessly monitor their program’s memory usage across their nodes. The CLI should be invoked with ray memory.
Constraints: To keep things lightweight, my implementation cannot introduce any new dependencies. Ray Core relies solely on Click to build their CLI tools.
Click is a Python package for creating beautiful command line interfaces in a composable way with as little code as necessary.
What do distributed programmers care about?
For every distributed object reference, there are five key components a programmer should know:
- IP Address. On which node does the
ObjectReflive? - Process ID. Which active process on the node “owns” the
ObjectRefin scope? In other words, which specific process submitted the task? For example, if process “A” callsobj_ref = f.remote(i), “A” manages and ownsobj_ref. - Call Site. Where was the task submitted in my code (e.g., file name, line number)?
- Object Reference. These are references to the actual object in the distributed object-store.
- Size. How much space is my object taking up in our shared memory store?
The following are additional components that are very specific to Ray’s architecture pattern. You’re welcome to read the attached links, but I won’t go over them.
- Driver/Worker. Is the owner of the
ObjectRefa driver or a worker? - Reference Type. What state is our
ObjectRefcurrently in?
How do we fetch this data?
Fetching this data depends on the framework’s underlying communication protocols. Philipp Moritz and Robert Nishihara originally built Ray on top of a high performance Remote Procedure Call (RPC) framework called gRPC. In gRPC, each client has a stub that can decode server responses. Ray Core generates a NodeManagerServiceStub, which tracks submitted tasks across all nodes. As a result, we can use the NodeManagerServiceStub to expose statistics for each node, including the valuable memory info explained above.
A “Variables Profiler” for distributed programmers
Once we’ve fetched and unmarshalled our global memory data, we can serve it to users through our CLI in a user-friendly format. Here’s an example of a call to ray memory now:

With Click, I was able to add a ton of interactive functionality, where users can, for example, group by nodes, sort by object size, specify units of measurement, display object spilling statistics, and much more.
Of course, this isn’t the end-all-be-all solution, but for now, I consider ray memory to be the “Variables Profiler” for debugging distributed programs in Ray. In the future, we plan to make the CLI more interactive as done with Linux’s htop, and this will expand our birds-eye view even further.
Students should contribute open source
I started contributing to Ray 8 months ago, and another open-source project called Lux shortly after. In retrospect, it was a small yet formative aspect of my education at Cal. Now, I’m convinced that every undergraduate CS student should contribute to an open-source project in their college career. Here are some reasons why:
- Practice complements theory. Contributing to Ray and Lux complimented my theoretical courses with practical experience. For example, shortly after learning thread pools for multiprocessing in CS 162, Berkeley’s course on Operating Systems, I was asked to extend Ray’s Actor Pool API so that pools can donate threads to one another. In completing this task, I was able to work with actual code, understand industry use cases, and build upon a heavily used framework which in turn built upon my working knowledge of multiprocessing.
- Git: The class I wish I had in college. Following up on my last point, contributing to a growing open-source project requires a working knowledge of Git. By contributing on Ray and Lux, I learned how to (and why we should) fork a repository, how remote branches work, and how to communicate with the open-source community through pull requests (PR), issues, and (most exciting) releases.
- Meet awesome people. You’d be surprised to know how many great conversations I’ve had with people I didn’t think I’d ever meet. For example, a few months ago, I picked up a ticket on Lux from a guy named Dom. In my PR, we had a lively conversation discussing how to render histograms with a popular data visualization grammar called Vega, and the whole time I was wondering how he was so knowledgeable about the library as he gave detailed pointers. Afterward, I discovered that Dom is one of the famed co-creators of the Vega library! This story isn’t such a rare one—I often find that passionate programmers are always looking to contribute and explore their interests in the open-source community. As a result, it’s natural to find driven individuals with similar interests!
If you were previously on the fence about whether or not contributing to open-source was worth your time, I hope this post reveals a first-hand account of why you should and what you can learn as a result.
.
I want to thank Sang Cho for reviewing this article and mentoring me this past semester on Ray. Without a doubt, he is one of the awesome people I had the pleasure to work with through the open-source world.
As always, feedback is always appreciated. Tell me what you loved, hated, found intruiging, or found boring.